
Ripple’s price has been on a massive uptrend over recent weeks, even with the flash crash it experienced a couple of weeks ago.
Yet, for a further bullish continuation to materialize, a specific resistance range needs to be overcome.
By Edris Derakhshi (TradingRage)
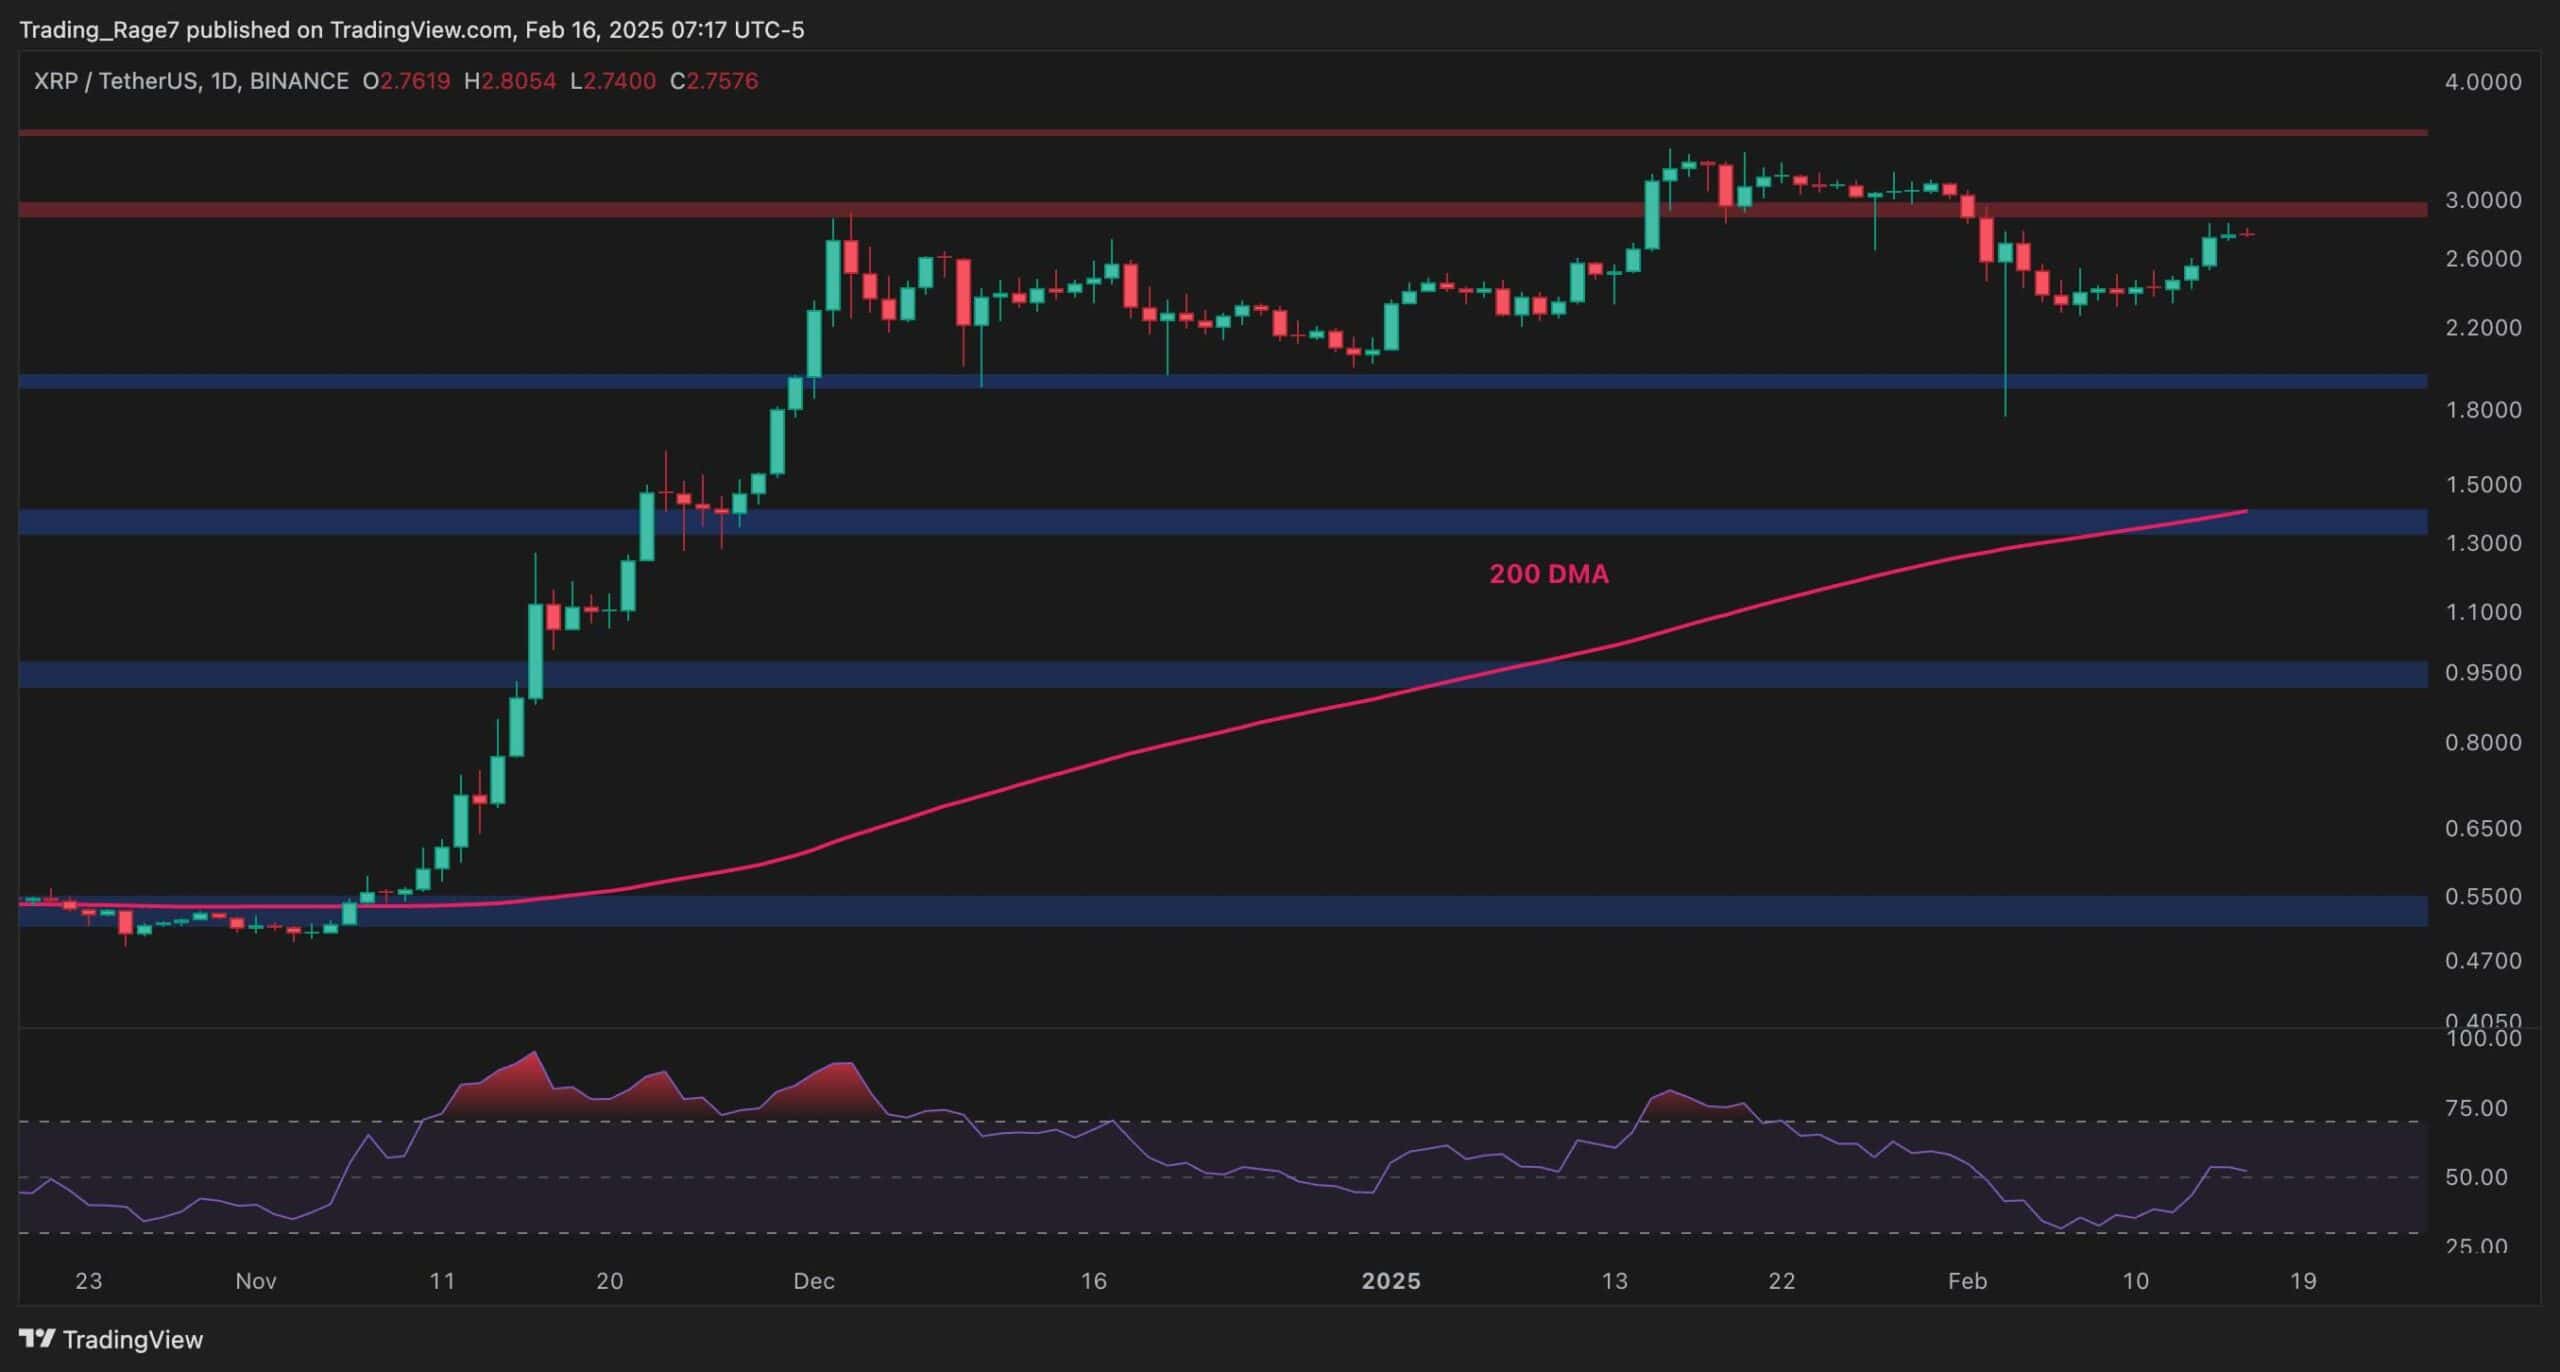
The USDT Paired Chart
Against USDT, the cryptocurrency has recently gone through a quick drop toward the $2 support level but has been able to rebound quickly. Currently, the price is bound to test the $3 resistance zone, and in case of a breakout, a rally toward $4 could be expected in the coming weeks.
On the other hand, a rejection could see the market fall back to the $2 area and even lower.

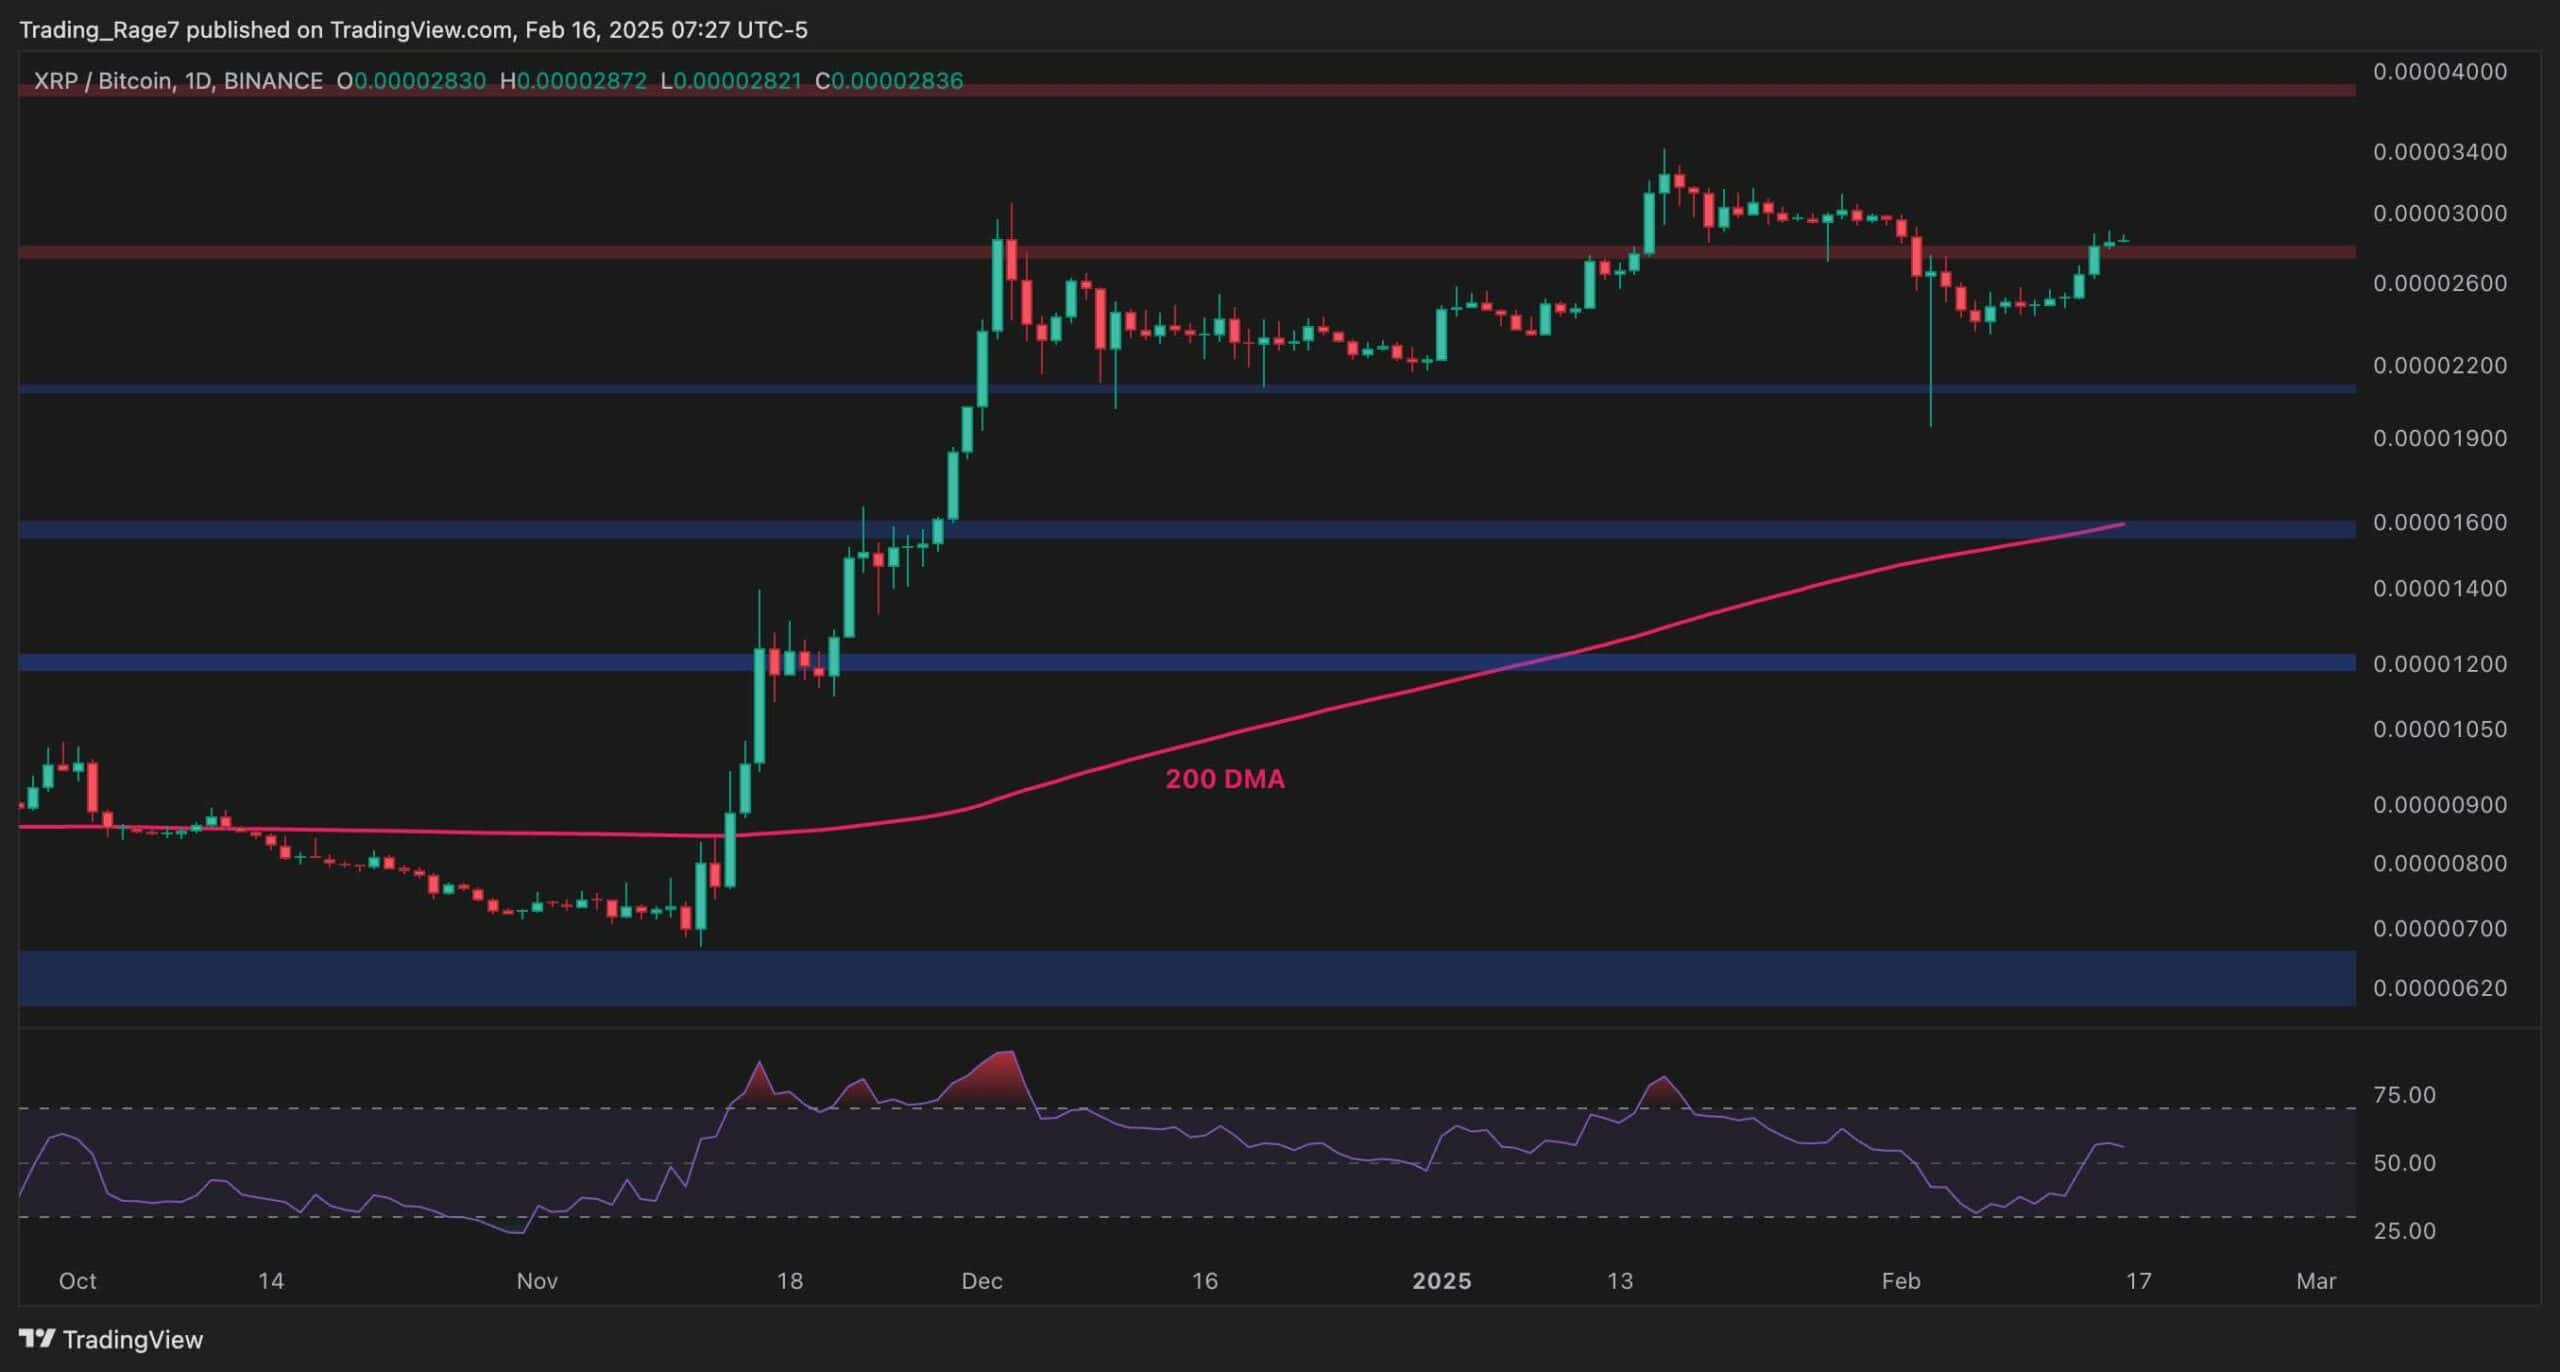
The BTC Paired Chart
The XRP/BTC pair’s daily chart shows a more optimistic picture, as the market is about to break the key resistance level of 2,800 SAT to the upside.
The RSI is also showing values above 50%, indicating that the momentum is in favor of a bullish move. A breakout above the 2800 SAT zone would likely lead to a price surge toward the 4,000 SAT area, which could be seen as a massive move for XRP.
Binance Free $600 (CryptoPotato Exclusive): Use this link to register a new account and receive $600 exclusive welcome offer on Binance (full details).
LIMITED OFFER for CryptoPotato readers at Bybit: Use this link to register and open a $500 FREE position on any coin!
Disclaimer: Information found on CryptoPotato is those of writers quoted. It does not represent the opinions of CryptoPotato on whether to buy, sell, or hold any investments. You are advised to conduct your own research before making any investment decisions. Use provided information at your own risk. See Disclaimer for more information.
Cryptocurrency charts by TradingView.